Hackney Development Finance 2026: Sub-Zone Anatomy, Capital Stack & BTR Take-Outs
Hackney is down 2.5% year on year in February 2026, against a Greater London headline of -3.3%. On the surface that is a borough sitting roughly on the regional average, slightly better than the line. The surface read is wrong. The Hackney number is the most misleading single figure in the London 2026 borough table, because the borough is not one market. It is at least four — and the four are pulling in opposite directions.
This piece is the operator-level sub-zone read on Hackney in 2026. What is actually happening in Stoke Newington versus Hackney Central versus Hackney Wick versus Shoreditch, what lenders are pricing on each, where the institutional BTR take-out economics now sit, and how the capital stack structures on a typical mid-cap Hackney scheme today.
Why Hackney is the most nuanced borough in the 2026 read
Hackney was the lead “next Hackney” story of the 2015 to 2022 cycle. Buyers from Islington and Camden displaced east. Prices ran hard. Shoreditch and Hoxton became inner-zone tech-and-creative postcodes priced like inner west. Stoke Newington became a serious family-market borough in its own right. Hackney Wick rode the Olympic Park edge into a new densification zone.
Post-2022, the borough has been digesting that cycle. Build costs rose. Senior debt margins widened. The open-market resi pricing model that underwrote the 2015 to 2022 boom stopped clearing on a measurable share of consents. By 2026 the picture is genuinely split. Stoke Newington and Hackney Central still have demand depth and clear viability on the right product. Shoreditch and Hoxton sit closer to the Tower Hamlets BTR pipeline economics — institutional take-out, not open-market resi. Hackney Wick is in regeneration mode, riding the canal-side density schemes on the Olympic Park fringe.
The borough average being -2.5% is what you get when you weight all four together. None of the four sub-zones is actually transacting at -2.5%. Stoke Newington is closer to flat. Hackney Central is around the borough number. Shoreditch is materially worse. Hackney Wick depends entirely on whether you are reading open-market completions or institutional forward-fund take-outs. Underwrite Hackney as one number and you will misprice the site by hundreds of pounds per square foot in either direction.
Reading the -2.5% in context
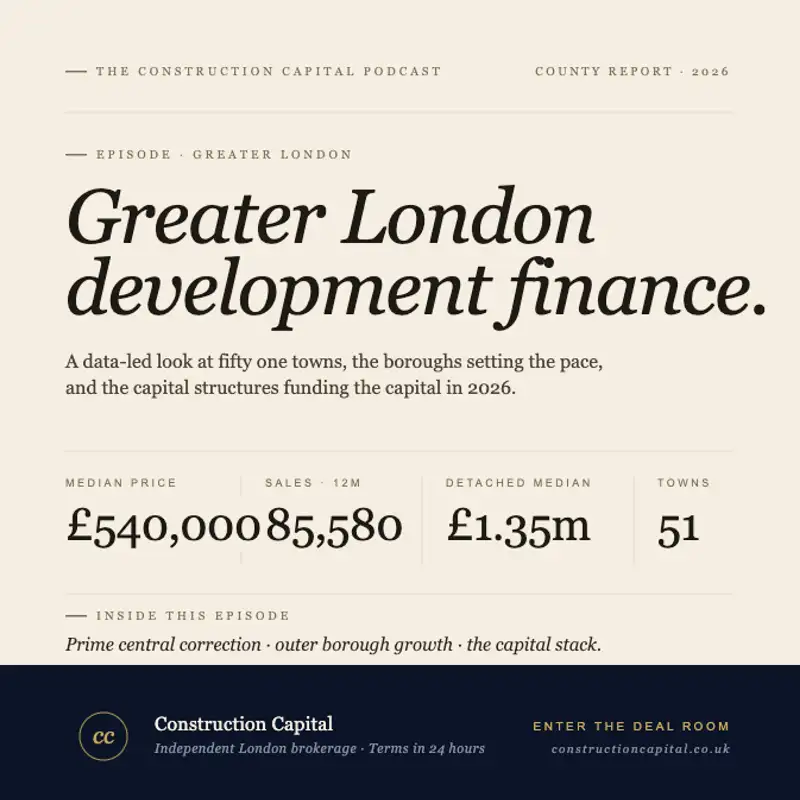
Greater London’s headline house-price index fell 3.3% year on year in February 2026 to a regional median of around £542,000 across roughly 85,580 transactions in the rolling twelve months. New-build completions ran at just 1.9% of total activity. Hackney’s -2.5% is a 0.8 percentage point relative outperformance against that benchmark. Quiet, but real.
For context on either side. Walthamstow, the next-door inner-east outperformer, is up 5.9% over the same window — driven by Victoria Line and Overground catchment depth and a much shallower 2015 to 2022 boom to digest. The Walthamstow-Hackney spread is now 8.4 percentage points and is the cleanest illustration in the table of how much the prior cycle still matters. Walthamstow had less to give back. Hackney had more.
At the other end, Kensington and Chelsea is down 11.2% and Westminster is down 10.8% over the same window. That is the prime central correction story — and it sits a full eight to nine percentage points worse than Hackney. So Hackney is not in the prime correction camp. It is mid-band, digesting an inner-east boom with sub-zone variance that the borough average masks.
The sub-zone anatomy: Stoke Newington, Hackney Central, Hackney Wick, Shoreditch
Stoke Newington and the northern half (Stoke Newington, Lower Clapton, parts of Stamford Hill). Family-resi market, two-storey and converted Victorian terrace stock, with an active townhouse and family-flat new-build pipeline along Stoke Newington Church Street and the Clapton periphery. Demand depth is being supported by buyers exiting Islington who want comparable architecture at lower prices. Open-market resi here is closer to flat year on year than it is to the -2.5% borough number. Senior debt is available on the right scheme at competitive terms.
Hackney Central and the spine (Hackney Central, Dalston, Hackney Downs). The Overground orbital connectivity through Hackney Central into Highbury & Islington and out to Stratford anchors the catchment. Mid-rise resi-led schemes around the Hackney Central station area, the Dalston Junction node and the Hackney Downs corridor are the borough’s most consistently-financeable product. This is where the -2.5% borough number actually applies as a fair read.
Hackney Wick and the Olympic Park fringe. Pure regeneration-mode. Canal-side density schemes, brownfield, often 6 to 20 storeys, taking institutional BTR or co-living take-out at scale rather than running through open-market resi. The Hackney Wick economics are a take-out yield calculation, not an open-market resi appraisal. Institutional BTR forward-fund yields here sit at 5.0% to 5.5% net, which is pricing closer to the Tower Hamlets institutional pipeline than to Hackney Central open-market resi.
Shoreditch and Hoxton (the southern fringe). The hardest part of the borough in 2026. Shoreditch and Hoxton sit on the Liverpool Street terminus catchment and the Lizzie Line interchange pulls through into the southern fringe, but the open-market resi pricing model that underwrote the 2015 to 2022 inner-east tech boom has materially softened. Shoreditch is the sub-zone pulling the borough average down hardest. Several Shoreditch schemes that were originally underwritten as open-market resi are now being repositioned as BTR or co-living forward-funds because the take-out values clear where the open-market values do not.
What lenders are pricing on Hackney schemes in 2026
Following the Bank of England’s December 2025 cut to 3.75%, the all-in capital stack on a typical Hackney scheme is mid-band. Neither connected-outer competitive nor prime-correction cautious. The pricing reflects the sub-zone variance directly.
Senior development finance is available from 6.5% per annum at 65 to 70% LTGDV for an experienced developer with strong cost certainty on a Hackney Central or Stoke Newington resi-led scheme in the 60 to 250 home range. Stretched senior products start around 7.5% and reach 75% LTGDV where the cost plan and contractor are bankable. Mezzanine finance pricing starts at 12% per annum and stretches gearing to 85 to 90% of cost. Bridging on Hackney Wick land-assembly windows and Shoreditch off-market opportunities starts from 0.55% per month at up to 75% LTV.
The BTR forward-funding layer is where the capital structure on Hackney Wick and Shoreditch schemes really differentiates. Institutional BTR take-outs are clearing 5.0% to 5.5% net yields on credible Hackney Wick density and Shoreditch repositioning schemes. That take-out yield does two things. First, it removes the open-market resi sales risk from the back end of the appraisal, which compresses senior pricing on the construction layer by 25 to 50 basis points. Second, it changes the GDV input row entirely — the appraisal is run on capitalised rent at a forward yield, not on per-square-foot resi sales comparables. For a Shoreditch site that does not clear the £650 per square foot open-market test on resi, the BTR take-out at 5.25% net yield can rescue the residual.
For the right Hackney scheme, blended all-in pricing now lands in the 6.5% to 9.0% range on a Hackney Central or Stoke Newington resi-led structure, and as low as 5.5% to 7.5% on a Hackney Wick or Shoreditch BTR forward-funded structure where the institutional take-out is locked. That spread is the operative input to every Hackney site appraisal in 2026.
The BTR forward-funding multiplier in Hackney Wick and Shoreditch
This is the structural story that the borough average obscures. Hackney Wick and Shoreditch are now institutional BTR markets in everything but legal classification. Forward-fund commitments from the major UK and European institutional capital pools have been the single largest source of pre-completion equity into both sub-zones across 2025 and into 2026. The take-out yield range of 5.0% to 5.5% net is tighter than what is clearing in any other inner London borough except parts of Tower Hamlets and Southwark.
The implication for site acquisition is that Hackney Wick and Shoreditch land basis is being underwritten on a different equation than Hackney Central or Stoke Newington land basis. A Hackney Wick site needs to support the BTR yield calculation, with credible rental tone, density consent, and operational delivery economics. A Hackney Central site needs to support the open-market resi calculation. Same borough average, completely different appraisal model.
What is actually transacting in Hackney
Three categories of scheme are running across the borough in 2026.
Mid-rise resi-led on Hackney Central and Stoke Newington. Typically 4 to 10 storeys, 60 to 250 homes, brownfield, around the Hackney Central station area, the Dalston Junction corridor, the Stoke Newington and Lower Clapton spines. These are the schemes clearing fastest under the Time-Limited Planning Route at 20% affordable housing by habitable room. Open-market resi sales model, senior debt available on competitive terms.
Hackney Wick density and BTR forward-funds. Canal-side, Olympic Park edge, typically 8 to 20 storeys, brownfield density. Institutional BTR or co-living take-out at 5.0% to 5.5% net yield. The capital stack runs construction-debt-to-forward-fund-take-out rather than construction-debt-to-open-market-sales.
Shoreditch repositioning schemes. Often previously consented as open-market resi or commercial-led mixed-use, now being restructured into BTR or co-living to clear viability. The repositioning unlocks an institutional take-out where the open-market resi appraisal had stalled. This is where the borough’s most active land-assembly bridging finance is currently being deployed.
How the capital stack works on a £20-30m GDV Hackney scheme
A typical Hackney Central or Stoke Newington town-centre scheme at this scale, with strong PTAL within a 10-minute walk of an Overground station, and a clean planning consent under the new NPPF regime, can be financed with senior development finance at 65% LTGDV (around 6.5% to 7%), mezzanine layered to 90% of cost (12% plus), and a modest equity or JV equity component to close the gap. Total senior plus mezz cost-of-funds blends in the high sevens.
On a Hackney Wick BTR-forward-funded scheme of similar scale, the structure is different. The institutional forward-fund commitment de-risks the take-out at 5.0% to 5.5% net yield, which compresses the senior layer by 25 to 50 basis points and reduces the mezzanine stretch required. Blended cost-of-funds on a forward-funded Hackney Wick scheme can sit in the high sixes — meaningfully tighter than the equivalent open-market resi structure. That spread is the operative argument for repositioning a Shoreditch consent into a BTR product where the rental tone and density support it.
On a larger scheme (£40m to £80m GDV), the institutional senior pool re-engages, multiple mezzanine providers compete for allocation, and the BTR forward-funding conversation widens to include co-living and PBSA-adjacent operators. Hackney supports materially larger consents than Bromley or Croydon — the inner-east BTR pipeline depth makes the £40m+ structure routine here in a way it is not yet in the outer-south boroughs.
What this means for Hackney site acquisition
If you are pricing land in Hackney in 2026, three things matter more than they have in any recent cycle.
One, the sub-zone read is the appraisal. A Stoke Newington site, a Hackney Central site, a Hackney Wick site and a Shoreditch site are four different propositions with four different capital structures and four different take-out models. The borough average tells you nothing useful about any individual site.
Two, the BTR forward-fund take-out is now a real lever in Hackney Wick and Shoreditch. A site that does not clear the £650 per square foot open-market test on resi can clear a 5.25% net yield BTR take-out. That is a structural opportunity, but it requires the right scheme architecture, credible rental tone, and an institutional partner. It is not a default outcome.
Three, the post-NPPF planning regime, the Mayor’s emergency package and the Time-Limited Planning Route together favour Hackney schemes that move quickly. Capital is available for Hackney schemes ready to start, whether that is conventional development finance, bridging for a tight Hackney Wick land-assembly window, or a development exit refinance for a Hackney Central project completing in late 2026.
For full borough-by-borough sold price data, the Hackney sub-zone pipeline references, viability modelling and the underlying capital stack benchmarks behind this analysis, see the Greater London Property Market Report 2026. Borough-specific intelligence sits on the Hackney location page.
See also: Walthamstow +5.9% on YouTube and The £650/sq ft Cliff on YouTube.
Listen to the full episode
For the dedicated deep dive on this borough, we have published a stand-alone Hackney episode of the Construction Capital podcast: Hackney -2.5%: The Sub-Zone Story Behind the Borough Average. Around ten minutes covering the Stoke Newington versus Hackney Central versus Hackney Wick versus Shoreditch sub-zone read, the BTR forward-fund yields driving Hackney Wick and Shoreditch repositioning, the full April 2026 capital stack, and what is actually transacting in 2026.
This article also draws on Episode 2 of the Construction Capital podcast: Greater London Property Development Finance 2026: Market Analysis, House Prices and Lending Outlook. The full borough-level data, policy detail and capital stack discussion runs 15:30, with chapters covering Walthamstow, Bromley and the inner-east boroughs within the wider Greater London outlook.
Listen anywhere
Listen on Apple Podcasts, Spotify, Overcast, Pocket Casts, or Amazon Music.
For indicative terms on a Hackney scheme within 24 hours, submit through the Construction Capital deal room.
Published by Construction Capital, an independent capital advisory brokerage sourcing terms from over 100 lenders across development finance, bridging, mezzanine, and equity. This article is part of the Greater London 2026 series accompanying the Construction Capital podcast.